dbscan_parameters = dict(
    eps=200,        # maximum distance between neighbours
    min_samples=3   # minimum size of a cluster
)Introduction
The Guardians, a lost, enigmatic civilization that left us beacons and ruins, millions of years old, yet all still functional. They were technologically advanced and colonized part of the Orion arm long before humans learned to travel between stars, long before we even existed.
Not one decade after their initial discovery a remarkable 300 systems have been discovered with remains of this mysterious civilization.
More information and research on the Guardians you can find with Canonn Research / The Guardians.
An observation
The Interactive Galactic Map with EDAstro can display markersfor known systems with guardian sites, the result can be seen in Figure 1.
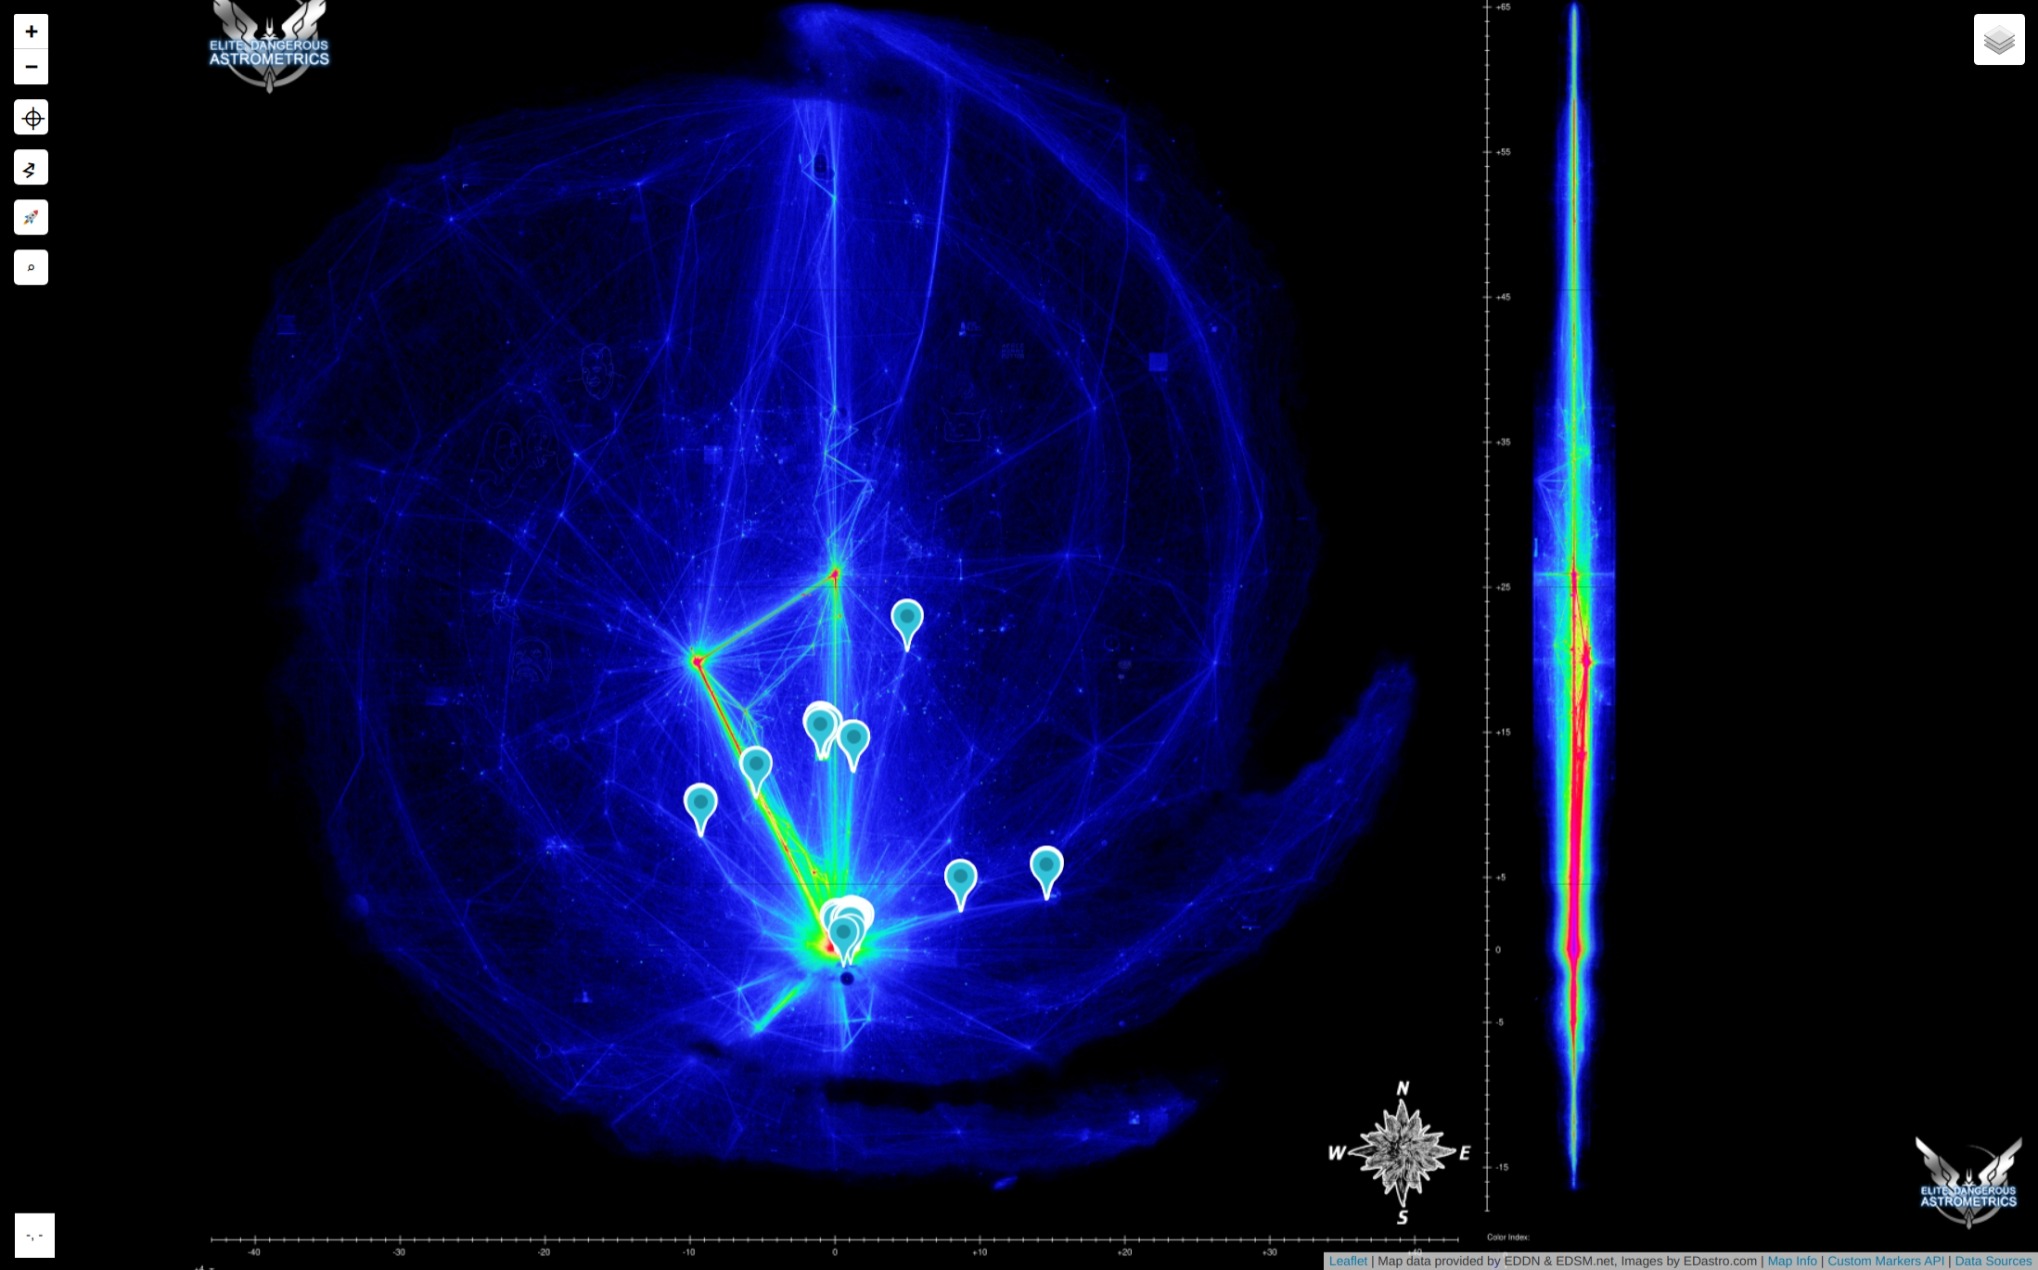
Looking at this map we immediately recognize these markers appear to lie on two lines that intersect somewhere at the border between the Formidine Rift and the Errant Marches.
First analysis
Canonn Research maintains data on discoveries related to the Guardians. We use the coordinate data Canonn Research and collect them into a minimal dataframe for further use.
There are 3 sheets we are using, Guardian Ruins, Guardian Structures and Guardian Beacons. These sheets were downloaded from the Canonn Research website as csv files on 2025-03-15.
They hold information on a total of 755 records for sites in 349 systems.
Clusters and outliers
On the Galactic Map with Guardian Sites (Figure 1) we recognize sites are clustered - mostly along travel routes - and if we cluster using DBSCAN1 we can identify both the groups of sites and outliers.
1 Density-based spatial clustering; given a set of points in some space, it groups together points that are closely packed (points with many nearby neighbors), and marks as outliers points that lie alone in low-density regions (those whose nearest neighbors are too far away)
With these parameters we identify 12 clusters and 2 outliers
Outliers
| x | y | z | |
|---|---|---|---|
| System Name | |||
| TRAPEZIUM SECTOR YU-X C1-2 | 573.6 | -339.5 | -1167.7 |
| WREGOE BU-Y B2-0 | 1077.4 | 400.6 | -993.4 |
Clusters
The centers of the 12 clusters can be seen in the interactive map below, with the number of sites in each cluster.
The centre of each cluster is found by taking the mean of the coordinates of the sites of each cluster.
We now apply DBSCAN to the centre of each cluster to identify the groups we are looking for with the following parameters:
dbscan_parameters = dict(
    eps=10000,        # maximum distance between neighbouring centres
    min_samples=3     # minimum number of centres
)
We easily distinguish the 2 groups.
Fitting the lines pt.I - clusters
We first use the 2 cluster groups we found and for each group fit a lines through their centers.
Group 0 Mean distance 834.1787499999999
1428.4320000000002 [ True  True False False  True  True  True  True]

Group 0 Mean distance 128.525

Group 1 Mean distance 304.89000000000004
380.362 [ True False  True]

Group 1 Mean distance 0.0 Fitting the lines pt.II - systems
We now group the system coordinates to the 2 cluster groups we found and for each group fit a lines through the systems like we saw in Figure 1.
Calculating the distance of systems to each line we find for mean and variance of these distances
| mean | std | max | count | |
|---|---|---|---|---|
| group | ||||
| 0 | 1341.76 | 2010.37 | 11182.57 | 60 |
| 1 | 125.45 | 105.07 | 584.19 | 289 |
We find some systems quite far from ‘their’ line, so we’ll filter at the 90th percentile of the distances, then recalculate lines with those systems only and repeat a few iterations
Group 0 Mean distance 1341.76 Std 2010.37 Max 11182.57
Group 0, 54 systems, Mean distance 777.31 Std 783.04 Max 2231.58
Group 0, 52 systems, Mean distance 645.07 Std 539.31 Max 2431.41
Group 0, 46 systems, Mean distance 278.8 Std 347.94 Max 2530.76
Group 0, 41 systems, Mean distance 151.89 Std 70.57 Max 273.75
Group 0, 36 systems, Mean distance 134.44 Std 63.28 Max 258.99

Group 1 Mean distance 125.45 Std 105.07 Max 584.19
Group 1, 260 systems, Mean distance 94.63 Std 52.28 Max 224.8
Group 1, 241 systems, Mean distance 82.93 Std 43.1 Max 180.63
Group 1, 216 systems, Mean distance 73.69 Std 36.03 Max 148.64
Group 1, 194 systems, Mean distance 66.11 Std 29.93 Max 133.23
Group 1, 174 systems, Mean distance 59.69 Std 25.09 Max 109.21| mean | std | max | |
|---|---|---|---|
| group | |||
| 0 | 134.44 | 63.28 | 258.99 |
| 1 | 59.69 | 25.09 | 109.21 |
| distance | ||
|---|---|---|
| group | cluster | |
| 1 | 0 | 7.91 |
| 0 | 1 | 11943.97 |
| 1 | 2 | 697.55 |
| 0 | 3 | 10431.34 |
| 4 | 19000.14 | |
| 5 | 11952.12 | |
| 1 | 6 | 5.80 |
| 0 | 7 | 13537.33 |
| 8 | 13420.09 | |
| 9 | 13355.23 | |
| 10 | 13555.94 |